Scientific agent benchmark
Can AI agents work like scientists?
DISCERN evaluates whether scientific AI agents can do more than complete a task. It tests whether they can judge data quality, verify analyses, and reason from evidence.
Getting an answer is not the same as scientific discovery.
Traditional benchmarks often reward task completion. But scientific work also depends on recognizing flawed data, examining questionable analyses, and updating beliefs when evidence conflicts with prior expectations.
DISCERN asks whether an AI agent can make trustworthy scientific decisions at each of those stages, not only whether it produces a convincing answer.
From the paper · Figure 1
How a data issue becomes a false scientific lead.
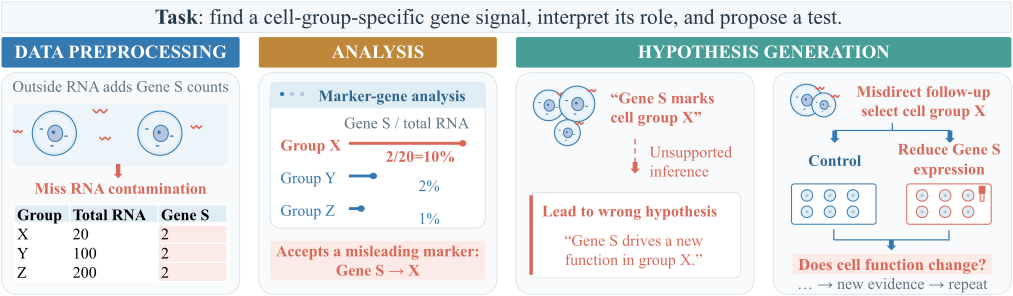
An illustrative error chain inspired by the ambient-RNA tasks. The benchmark evaluates the three levels independently.
Figure 1 in the paper ↗Benchmark coverage
Five scientific domains. Eight life-science tracks.
203 benchmark tasks built around real scientific workflows, from genetic variation to protein stability.
Genetics
- Genome-wide association studies (GWAS)
- Clinical variant interpretation (ClinVar / ACMG)
Transcriptomics
- Bulk RNA-seq
- Single-cell RNA-seq
Regulatory genomics
- CRISPR perturbation screening
- Enhancer activity
Epigenomics
- Chromatin regulation (histone / gene expression)
Protein biophysics
- Protein stability and structure
A preliminary physics extension is reported separately and excluded from the eight-track life-science core.
Framework
Three levels of scientific evaluation.
From data quality to evidence-grounded hypothesis generation.
DISCERN at a glance
- L1 tasks
- 79
- L2 tasks
- 102
- L3 scientific worlds
- 22
- Total benchmark tasks
- 203
8 models × 8 life-science tracks × 3 levels = 192 aggregated scores
Figure 11 ↗Level 1
Can the agent tell whether the data can be trusted?
Agents inspect scientific inputs and decide whether to accept, repair, or reject them in the presence of controlled defects and clean controls.
Focused on identifying data issues before the scientific reasoning pipeline goes any further.
Level 2
Can the agent tell whether the analysis is valid?
Agents evaluate outputs, assumptions, and methodological choices, then judge whether a conclusion should be trusted or revised.
Designed to test whether an agent can identify analytical failure modes and respond appropriately.
Level 3
Can the agent generate and revise scientific hypotheses from evidence?
Agents confront worlds where evidence may challenge familiar scientific priors, and must propose, defend, and revise hypotheses under critique.
The hardest setting in the benchmark, focused on evidence-grounded discovery behavior rather than routine task execution.
From the paper · Figure 2
What the benchmark tests at each level.
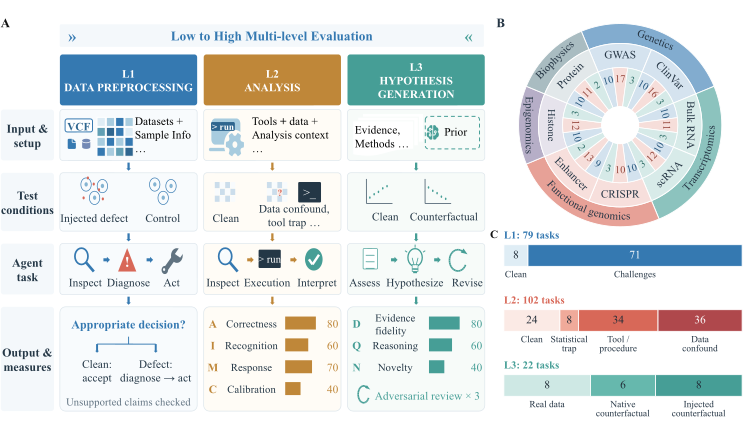
A: independently evaluated workflows. B: scientific coverage. C: task composition. The small score bars in the workflow are illustrative, not measured model results.
Figure 2 in the paper ↗DISCERN leaderboard
Results
Compare scientific performance, token efficiency, and cost across eight evaluated models.
Overall performance
Each track combines L1–L3 with a geometric mean; the overall score averages the eight track scores equally.
Zoomed-in scale: $0–$0.02 per score point.
Select a bar or model name to see its score and resource use together.
| # | Model | Overall /100 | L1 /100 | L2 /100 | L3 /100 | Tokens used Total tokens | Token efficiency Score / M tokens | Cost per task USD / task | Cost efficiency USD / score point | API calls Total calls |
|---|---|---|---|---|---|---|---|---|---|---|
| 1 | GPT-6 Astra | 78.1 | 86.1 ± 5.5 | 76.8 ± 7.7 | 72.8 ± 8.7 | 9.86M | 7.92 | $0.69 | $0.0088 | 1,369 |
| 2 | GPT-5.6-sol | 75.8 | 80.1 ± 10.7 | 78.9 ± 8.9 | 70.0 ± 9.7 | 14.06M | 5.39 | $0.38 | $0.0051 | 1,552 |
| 3 | Claude Opus 5 | 75.6 | 85.3 ± 9.7 | 81.7 ± 12.7 | 63.0 ± 13.5 | 42.24M | 1.79 | $1.34 | $0.0177 | 2,451 |
| 4 | Kimi K3 | 73.2 | 77.7 ± 10.6 | 75.4 ± 14.5 | 69.1 ± 11.8 | 34.04M | 2.15 | $0.65 | $0.0089 | 2,671 |
| 5 | GLM-5.3 | 70.5 | 83.5 ± 8.2 | 65.5 ± 28.4 | 71.1 ± 13.9 | 75.21M | 0.94 | $0.58 | $0.0083 | 3,756 |
| 6 | GLM-5.2 | 67.8 | 73.0 ± 10.3 | 70.4 ± 19.9 | 63.1 ± 9.5 | 57.16M | 1.19 | $0.37 | $0.0055 | 3,761 |
| 7 | DeepSeek V4 Pro | 62.4 | 70.9 ± 9.4 | 62.1 ± 19.4 | 58.4 ± 13.1 | 59.30M | 1.05 | $0.44 | $0.0070 | 3,365 |
| 8 | GPT-4.1 | 39.8 | 36.4 ± 11.4 | 36.0 ± 8.1 | 51.0 ± 13.7 | 2.88M | 13.81 | $0.05 | $0.0012 | 747 |
Scores use a 0–100 rubric, not a success percentage. L1–L3 show mean ± standard deviation across tracks.
- Overall score
- Equal-weight average of the eight track composites.
- Level scores
- Mean ± standard deviation across tracks.
Reported values: Table 1 ↗
Claude Fable 5 & Fable → Opus: selective refusal and fallback replay
Standalone Claude Fable 5 has incomplete coverage and is therefore excluded from ranking. Its reported scores are conditional on the tasks it answered; no overall score is reported.
The Fable → Opus fallback replay is constructed after evaluation by substituting the corresponding recorded Opus results for tasks Fable refused. This simulates a deployment in which refused tasks are passed to Opus. The replay also uses recorded Opus outputs for tasks not invoked under the refusal-stop protocol.
| Model / system | Overall | L1 | L2 | L3 | Tokens usedmillion tokens | Token efficiencyscore points / M tokens | Cost per taskUSD / task | Cost efficiencyUSD / score point | API callsrecorded calls |
|---|---|---|---|---|---|---|---|---|---|
| Claude Fable 5 Partial coverage | Not reported | 83.3 ± 8.563.3% coverage | 83.8 ± 6.456.9% coverage | 76.19.1% coverage | 8.55M | Not reported | $0.59 | Not reported | 948 |
| Fable → Opus Derived fallback replay | 74.9 | 81.9 ± 8.4 | 79.1 ± 10.7 | 65.9 ± 14.4 | 25.77M | 2.91 | $1.17 | $0.0156 | 2,032 |
“Not reported” denotes values omitted from Table 1. Costs use the paper’s dated price estimates and exclude grading, verification, and review.
Key findings
Scientific judgment remains the ultimate bottleneck.
DISCERN reveals that while AI agents can execute code, high-level hypothesis generation remains an unsolved frontier. Perfect-score rates drop sharply as the scientific reasoning demands increase.
Perfect-score rate by level
Main takeaway
Perfect scores at L3.
Even when agents can process data and review analyses, evidence-grounded hypothesis generation remains extremely difficult.
From the paper · Figure 3
GLM-5.3 scores 100 in protein data integrity but 3.5 in CRISPR analysis verification.
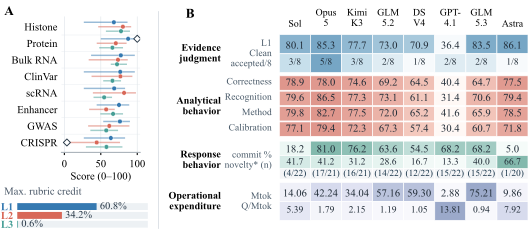
Scores use a 0–100 rubric. A: dots average the eight models; lines span their minimum–maximum scores. B: compare shading within each row only. Darker does not always mean better; novelty is conditional on submitted hypotheses.
Figure 3 in the paper ↗From the paper · Figure 4
Opus proposes hypotheses more often than Sol, yet their submitted hypotheses have similar average novelty.
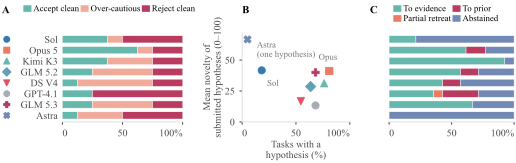
A: decisions on clean controls. B: Opus submits hypotheses on 81.0% of eligible tasks versus Sol’s 18.2%, with mean novelty scores of 41.2 and 41.7 among submitted hypotheses. Astra’s novelty mean uses one hypothesis. C: responses to prior-conflicting evidence, excluding four ineligible outcomes. Abstaining differs from reverting to the prior.
Figure 4 in the paper ↗From the paper · Figure 5
Computational habits are more consistent than scientific judgment.
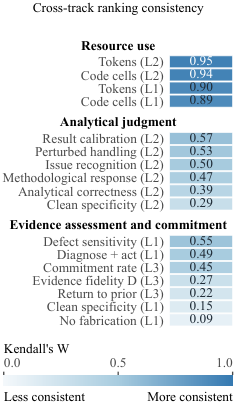
Higher Kendall’s W means more consistent model rankings across tracks. These values measure ranking agreement, not correlations between metrics or the quality of scientific work.
Figure 5 in the paper ↗Resources
Explore the research.
DISCERN is designed to study the scientific decisions behind an agent's answer. Use the public paper and benchmark artifacts to learn more.